The Insurance Value of Redistributive Taxes and Transfers
Job Market PaperDownload PDF
If your income falls, what catches you?
The traditional answer is social insurance programs like unemployment and disability insurance. People pay into these programs while they work and collect benefits if they are laid off or become too ill to work.
But in fact, most of the social safety net after a layoff or an illness comes from redistributive taxes and transfers. Tax rates go down and transfer benefits go up as a person’s income falls, which smoothes out income risks by redistributing from the high-income years to the low-income years within a person’s lifetime.
Income Losses Persist Post-Layoff or Hospitalization
And most social insurance comes from redistributive taxes and transfers
UI and DI
Increased Transfers
Decreased Taxes
Hypothetical Maximum
UI and DI measures unemployment and disability insurance benefits.
Increased Transfers measure other benefits, like cash welfare and child benefits, which increase as income falls.
Decreased Taxes measure federal and local taxes, which decrease as income falls.
Years Since Layoff
Using a panel of 1.6 million layoffs and 1.2 million hospital stays linked to Canadian income tax records, I examine how the two largest sources of income risk for working-age households—layoffs and illness—are insured by the tax and transfer system.
I find that progressive taxes and transfers are especially important for reducing the risk of catastrophic income losses.
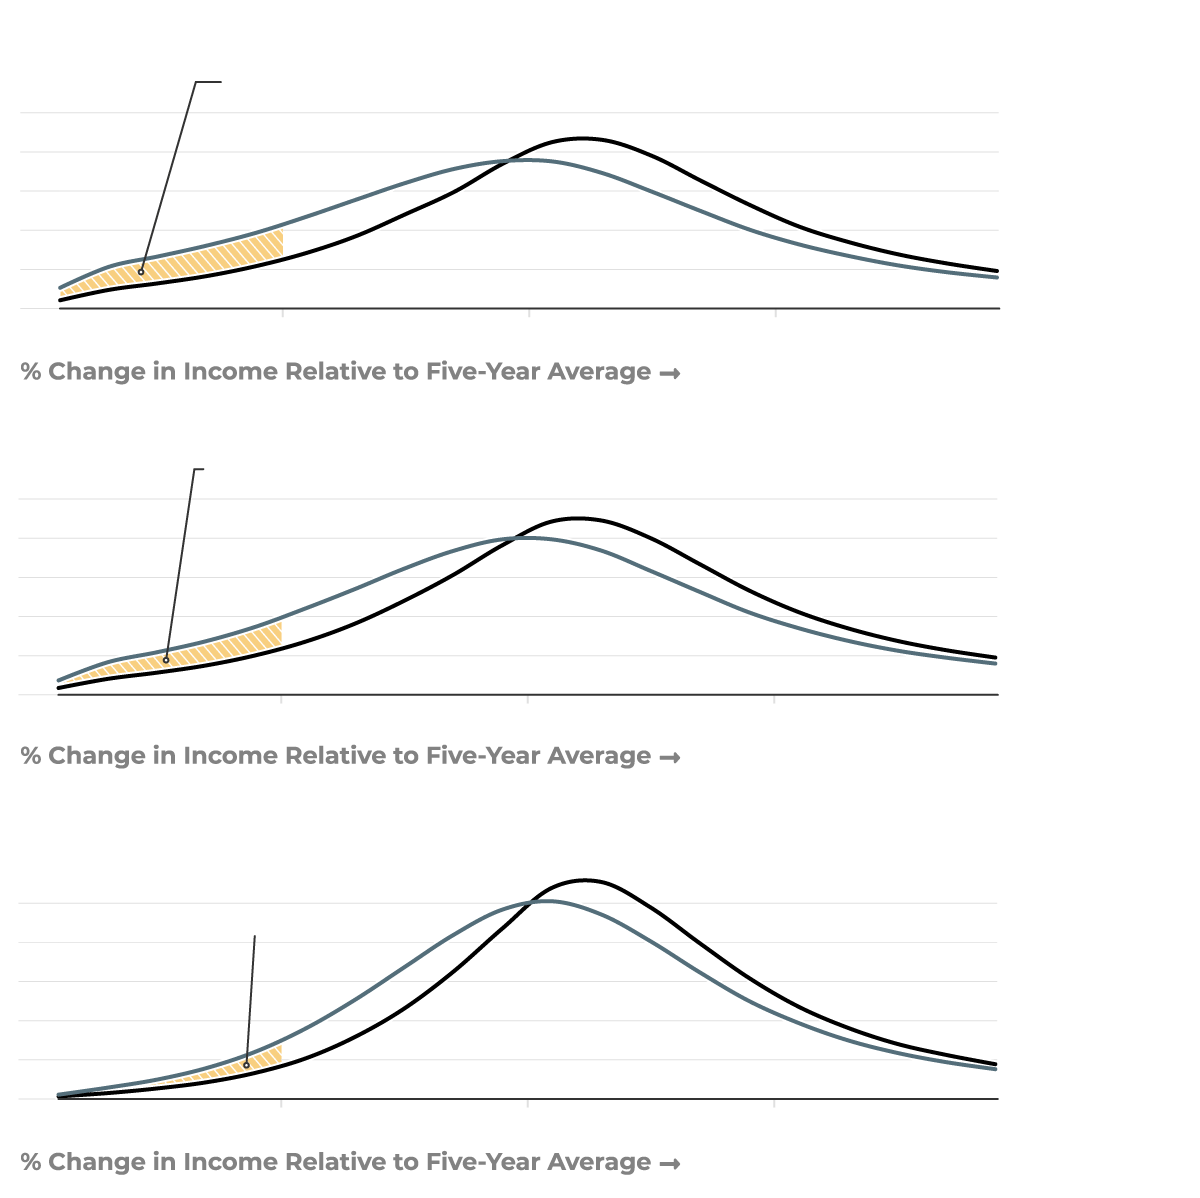
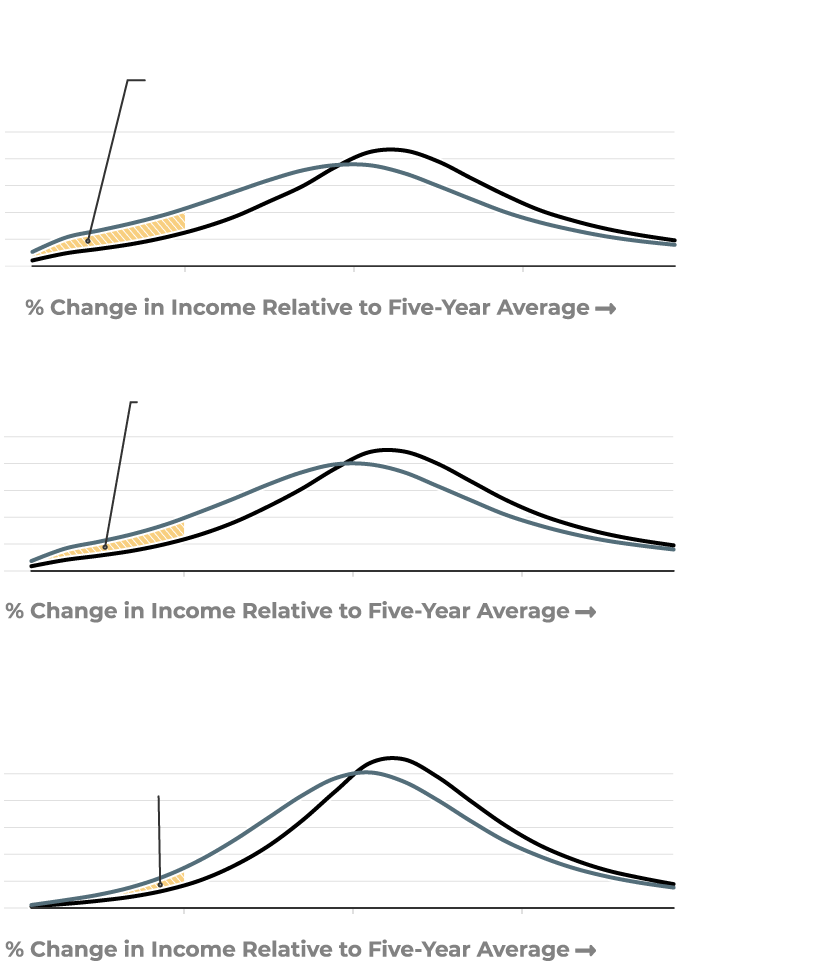
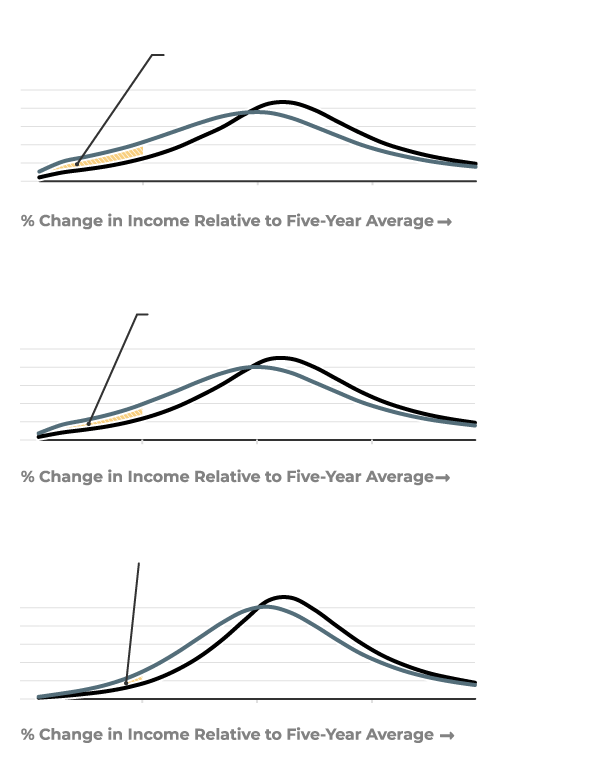
Layoffs Raise the Risk of Catastrophic Income Losses
Redistributive transfers lower that risk more than unemployment benefits
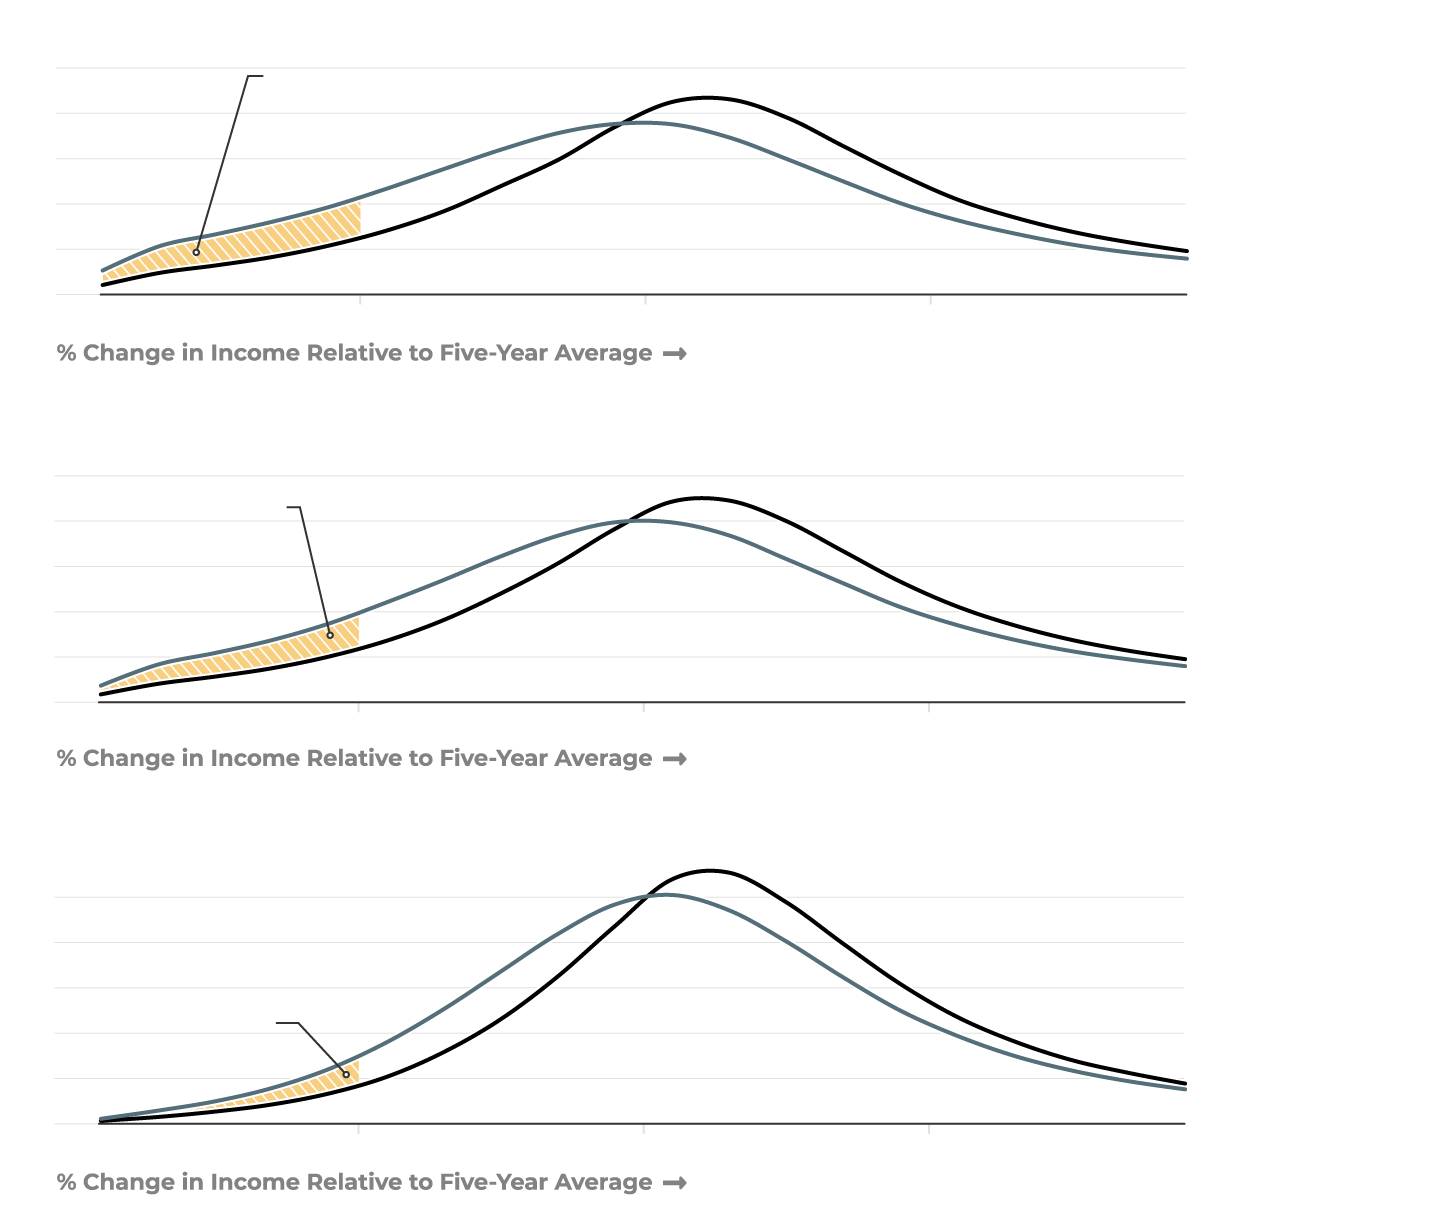
Before Taxes and Transfers
10% of Individuals
Laid off individuals are 6.5% more likely to have their income cut in half.
8%
6%
4%
2%
Not Laid Off
Laid Off
0
-50%
0%
+50%
After UI and DI
10% of Individuals
After UI and DI, that probability is reduced slightly, down to 5.0%.
8%
6%
4%
2%
Not Laid Off
Laid Off
0
-50%
0%
+50%
After Taxes and Transfers
10% of Individuals
But after taxes and transfers, layoffs increase the probability of a catastrophic income loss by only 2.5%.
8%
6%
4%
2%
Not Laid Off
Laid Off
0
-50%
0%
+50%
Before Taxes and Transfers
Laid off individuals are 6.5% more likely to have their income cut in half.
10% of Individuals
8%
6%
4%
Not Laid Off
2%
Laid Off
0
-50%
0%
+50%
After UI and DI
After UI and DI, that probability is reduced slightly, down to 5.0%.
10% of Individuals
8%
6%
4%
2%
Not Laid Off
Laid Off
0
-50%
0%
+50%
After Taxes and Transfers
But after taxes and transfers, layoffs increase the probability of a catastrophic income loss by only 2.5%.
10%
8%
6%
4%
2%
Not Laid Off
Laid Off
0
-50%
0%
+50%
Before Taxes and Transfers
Laid off individuals are 6.5% more likely to have their income cut in half.
10% of Ind.
8%
6%
4%
Not Laid Off
2%
Laid Off
0
-50%
0%
+50%
After UI and DI
After UI and DI, that probability is reduced slightly, down to 5.0%.
10%
8%
6%
4%
2%
Not Laid Off
Laid Off
0
-50%
0%
+50%
After Taxes and Transfers
But after taxes and transfers, layoffs increase the probability of a catastrophic income loss by only 2.5%.
10%
8%
6%
4%
2%
Not Laid Off
0
Laid Off
-50%
0%
+50%
Before Taxes and Transfers
Laid off individuals are 6.5% more likely to have their income cut in half.
10% of Individuals
8%
6%
4%
Not Laid Off
2%
Laid Off
0
-50%
0%
+50%
After UI and DI
After UI and DI, that probability is reduced slightly, down to 5.0%.
10%
8%
6%
4%
Not Laid Off
2%
0
Laid Off
-50%
0%
+50%
After Taxes and Transfers
But after taxes and transfers, layoffs increase the probability of a catastrophic income loss by only 2.5%.
10%
8%
6%
4%
Not Laid Off
2%
0
Laid Off
-50%
0%
+50%
The insurance value of redistributive taxes and transfers is highly progressive.
People who already have low incomes lose a disproportionate share of their income following a layoff or a hospitalization. But after taxes and transfers, the losses are much more level across the income distribution.
The tax and transfer system therefore mitigates inequality in income risk.
Shares of Income Lost Post-Layoff or Hospitalization
Are unequal before taxes and transfers but similar after taxes and transfers
UI and DI
Redistributive Transfers
Progressive Taxes
Hypothetical Maximum
UI and DI measures unemployment and disability insurance benefits.
Redistributive Transfers measure other benefits, like cash welfare and child benefits, which increase as income falls.
Progressive Taxes measure federal and local taxes, which decrease as income falls.
Laid off workers begin to experience a dip in earnings two years prior to the layoff, which matches the pattern first documented in mass layoffs by Jacobson, LaLonde, and Sullivan (1993). This earnings dip occurs along the intensive margin: workers have stable employment rates prior to being laid off, but their average earnings growth is slower in the two years leading up to being laid off.
Years Since Layoff
Redistributive taxes and transfers provide the majority of social insurance throughout the income distribution
Income Quintile
Methodology
I study the social insurance of 1.6 million layoffs and 1.2 million hospitalizations using an event study specification with a matched research design. Hospital stays for a childbirth are excluded from the analysis. Outpatient visits to the hospital and emergency room visits that did not result in an admission are also excluded.
I match 25- to 54-year-old Canadian workers who experienced a layoff or a hospitalization event between 2003 and 2010 to a comparison group of workers with identical demographic characteristics and nearly identical individual and household income in the third year prior to the event. I then compare the income trajectories of these workers to the matched comparison group using a non-parametric event study specification. This comparison identifies the causal effect of layoffs and hospitalizations on subsequent income if the income trajectories of people who are laid off or hospitalized would have evolved in parallel with the matched comparison group absent the event. The event study estimates show that the earnings trajectories of laid off and hospitalized workers were on parallel trends with their matched comparison group for more than a decade leading up to the adverse event. All of the variables used for matching are measured in the same year, therefore placing no constraints on the pre-trends.
The insurance value provided by taxes and transfers is defined as a person’s willingness to pay to avoid replacing the tax and transfer system with the linear tax rate that holds their expected consumption constant. I decompose this total insurance value into the components provided by formal social insurance programs, by redistributive transfers and by progressive taxes. I directly estimate the insurance value against the risks of layoffs and hospitalizations using the event study results and a model of peoples’ risk preferences and their ability to smooth consumption by saving and borrowing.
Since the distinction between insurance and redistribution depends which income changes are anticipated by individuals, I bound the total insurance value of the tax and transfer system against all income risk using bounds on the information that individuals use to anticipate their future income. Assuming layoffs and hospitalizations are unanticipated three years prior to the event, the total insurance value of taxes and transfers lies between the insurance value against layoff and hospitalization risk alone and the insurance value against all income variation conditional on the demographic and lagged income variables that I observe three years prior (which assumes that people have no private information about their future income dynamics).